The Early Keeling Curve
In the first part of the 20th century it was suspected that the concentration of atmospheric CO2 might be increasing in the atmosphere due to fossil fuel combustion. However there were relatively few measurements of this gas and the measurements varied widely.
In 1953 Charles (Dave) David Keeling began a post doctoral position at Caltech, Pasadena, California under Professor Harrison Brown. His initial project was aimed at extracting uranium from granite rock with applications in the nuclear power industry. He never really started this project but with encouragement from Professor Brown became involved in another project investigating the equilibria between carbonate in surface waters, limestone and atmospheric CO2. This involved the construction of a precision gas manometer to measure CO2 extracted from the air as well as acidified samples of water.
Dave Keeling found significant variations in CO2 concentration in Pasadena, probably due to industry, and later took his sampling equipment to Big Sur near Monterey. There he began to take air samples throughout the day and night and soon detected an intriguing diurnal pattern. The air contained more CO2 at night than during the day and after correcting for the effects of water vapor, had about the same amount of CO2 every afternoon, 310 ppm. He used stable isotope ratio mass spectrometry measurements of the CO2 he extracted to show that the 13C/12C ratio in CO2 at night was smaller than during the day and a function of plant respiration.
He repeated these measurements in the rain forests of Olympic peninsula and high mountain forests in Arizona. Everywhere the data were the same ...strong diurnal behaviour with steady values of about 310 ppm in the afternoon. The explanation for the results came from a book on meteorology describing diurnal patterns in turbulence in the atmosphere. In the afternoon Dave Keeling was measuring CO2 concentrations representative of the "free atmosphere", concentrations that prevailed over a large part of the Northern Hemisphere. At night time with a lower boundary layer the CO2 concentration was heavily influenced by respiration from local plants and soils.
Little did Dave Keeling know then that he had laid the basis for his remarkable career investigating the global behaviour of atmospheric CO2.
In 1956 Dave Keeling's measurements came to the attention of Harry Wexler at the US weather bureau and Roger Revelle at Scripps Institution of Oceanography. To both these organizations he proposed a global program based on infrared gas analyzers to measure the atmospheric CO2 concentration at several remote locations around the world including the South Pole station and at Mauna Loa in Hawaii. The proposal was supported by and became one of the features of the International Geophysical Year (IGY) beginning in July 1957 and ending in December 1958.
Using IGY funds from the Weather Bureau, Dave Keeling bought four infrared gas analyzers from the Applied Physics Corporation. One of these was installed at Mauna Loa in March 1958 and on the first day of operation recorded an atmospheric CO2 concentration of 313 ppm.
To Dave Keeling's surprise, however, the CO2 concentration at Mauna Loa had risen by 1ppm in April 1958 to a maximum in May when it began to decline reaching a minimum in October. After this the concentration increased again and repeated the same seasonal pattern in 1959. In Dave Keeling's words "We were witnessing for the first time nature's withdrawing CO2 from the air for plant growth during summer and returning it each succeeding winter" In 1959 the average concentration had increased and increased still further in 1960 as shown in the graph.
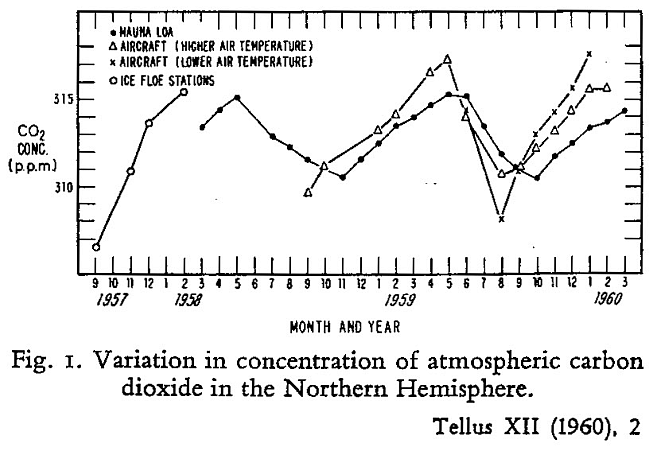
Dave Keeling's analytical skills and dedication had paid off with two dramatic discoveries: firstly, of the natural seasonal "breathing" of the planet and secondly, of the rise in atmospheric CO2 due to the combustion of fossil fuels by industry and to land use changes. Published in the 1960 Tellus Article, "The concentration and isotopic abundances of carbon dioxide in the atmosphere" (PDF), these significant findings marked the beginning of the now world famous "Keeling Curve" which extends for almost 5 decades and represents one of the most important geophysical records ever made.